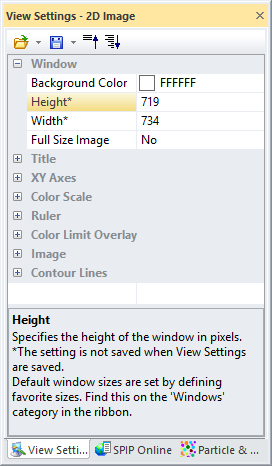
Most of the 2D view settings are self-explained; therefore we will only describe the least obvious parameters
Color Scale & Axes: When On the color scale, axes and title will be shown in the 2D image window. To use the full space for the Image it might be desirable to turn this setting off. Note, that there are more functions related to the color scale for setting the contrast and threshold values for various functions.
Color Scale Labels The color scale labels showing the height value associated with the different colors can be turned on/off.
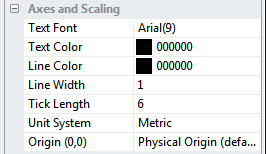
Unit System The unit system can be set to Metric or US. Within the selected system the most appropriate unit for each dimension will be selected.
Origin(0,0)
The origin of the coordinate system for an image can be defined in three ways:
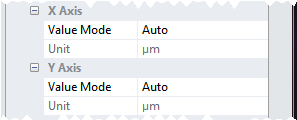
The X and Y Axis Value Mode have two options: Auto and Auto Range. In Auto mode the unit is selected by the program and in Auto Range the unit can be selected by the user.

In addition to the Auto and Auto Range Value Modes the Z Axis has a User Defined mode allowing setting the minimum and maximum values for the color scale. This may be practical for comparing images on exact the same z/color scale while the auto modes will adopt set the color scale range to fit the z-range of the image and assuring a good contrast.
In the Color Scale section all options related to the color scale are found.
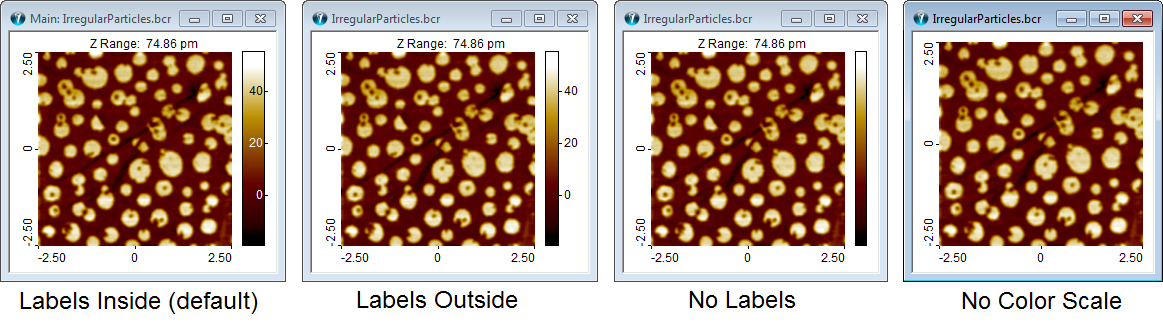
The four Color Scale display options (from left): Show labels inside the color scale is the compact default mode; alternatively the labels can be shown outside, not shown at all, or the entire Color Scale can be hidden.
It is optional to have the Color Scale visible in the image window. For viewing SEM images or other images where the contrast has no metrological meaning it is often desirable to free some screen space by not showing the Color Scale. For presentations and publications this can also be desirable.
Inside
The Color Scale labels are by default displayed inside the Color Scale. This is compact way, and the size of the labels are scaled down in order to fit inside the Color Scale. This mode is great for daily work, though sometimes the scaling may render the labels so small that they can hardly be read.
Outside
For presentation and publication it is often desirable to have the labels shown on the side of the Color Scale. In this mode the label size is not scaled but adheres to the chosen font size.
Off
The Labels can be switched off entirely. This also includes the color scale markers, which gives a more quiet visual appearance.
This option can be set to Auto, which will stretch or compress the color scale to the full Z range of the image. It will also choose the most natural unit prefix for the labels. In Auto Range mode, the unit prefix can be chosen by the user. In User Defined mode both unit and the Z values corresponding to the bottom (Minimum Value) and top (Maximum Value) of the color scale can set. This mode is particularly useful for comparing images. For comparing images it is useful to save View Settings with a fixed color scale range. To automatically apply these settings, the settings should be set as Default. There is a small danger though: If the color range is too small or is outside of the Z range of an opened image a warning will be given.
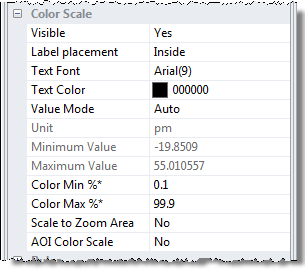
To improve the contrast further it is possible to set Color Min and Color Max percentiles such that outliers are excluded from the effective color range. These values can be controlled by the left color scale markers and their initial values are defined in the Preferences (File > Preferences > View)
This option determines if the non-AOI pixels should be included in the calculation for the z-range. You may use this setting for moving an AOI shape and obtain a good contrast adapted to the AOI area.
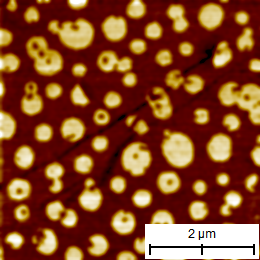
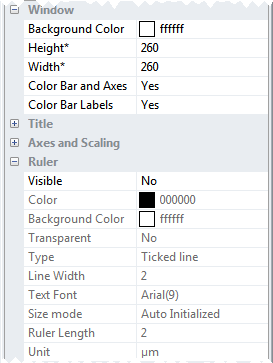
From the View Settings pane for 2D image window it is possible to define a ruler / scale bar, which can be shown in the image to indicate its size. This may be desirable if you want to publish the image without the color scale and x, y axes. The Ruler can easily be turned on/off from the View Panel of the image ribbon. Below are seen two images with and without the ruler.
|
|
|
|
|
|
|
Image with color scale and no ruler |
Image with ruler but no color scale |
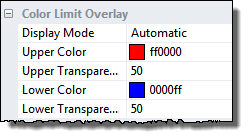
The color limit overlay controls how the color clip markers on the right of the color scale are visualized in the image. This way it is easy to visualize which pixels are outside the threshold boundaries and will have a special meaning for a given process. For particle analysis, for example, it is possible to adjust the threshold level such that the desired area will show up with a red overlay color before the actual particle analysis is processed. The overlay color will also be reflected in histogram windows making it easier to calculate parameters such and area and volume for structures with certain z-ranges.
The Display Mode is by default set to Automatic mode, which mean that it will be on at all time, except after a particle or pore analysis, in which case it is of higher interest to see the detected shapes overlaid. As soon as one of the color clip markers is moved the overlay colors will appear again. If needed, you can also set Display Mode such that the overlay will be visible all the time or never.
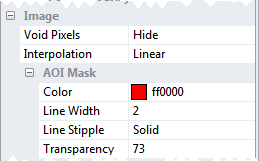
In the Image Section you can control how pixels marked as Void Pixels (Non measured pixels) are visualized: as invisible (using the background color) or based on the actual pixel value.
Interpolation may be used to get the smoothest looking image, however for detailed studies it might be more desirable to turn interpolation off.
The AOI Mask subsection determines how AOI shape overlays are visualized, See also the AOI section.
Contour lines may serve as tool for highlighting asymmetries in images and it can be set on/off in the View Settings of 2D Image Windows.
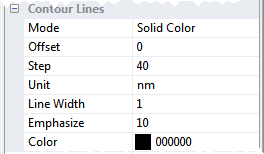
Mode: The mode value can be one of the following values: Color Scale with colors obtained from the color scale, Solid Color where a single color is used and With Image where the contour line is superimposed onto the colored image using a solid color.
Offset: The height value for a reference contour line
Step: The step distance between contour lines starting from the Offset value.
Unit: The Unit associated with the Offset and Step values
Line Width: The line width of the contour lines measured in pixels
Emphasize: Each N contour line can be emphasized by extending the line width.
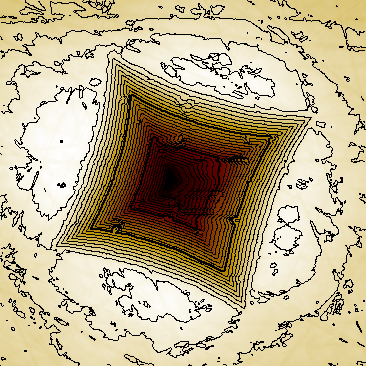
Below is seen an example of an image shown in the default color mode next to a contour plot. In the contour plot the slopes and asymmetry of the indentation is much better observed.